K8S 8: Setup Advanced EFK Stack on GCP cluster (ElasticSearch, Fluentd, Kibana)
Bài này hướng dẫn dựng EFK stack phức tạp hơn, dùng ConfigMap, ElasticSearch chia làm các role `master, client, data`, có áp dụng authentication cho Kibana để `more secure`.
Table of Contents
Giới thiệu
Bài này hướng dẫn dựng EFK stack phức tạp hơn, dùng ConfigMap,
ElasticSearch chia làm các role “master, client, data”,
có áp dụng authentication cho Kibana để “more secure”
Cách làm
Đầu tiên cần checkout source code này:
git clone https://github.com/hoangmnsd/kubernetes-series
cd kubernetes-series/efk-stack-advanced
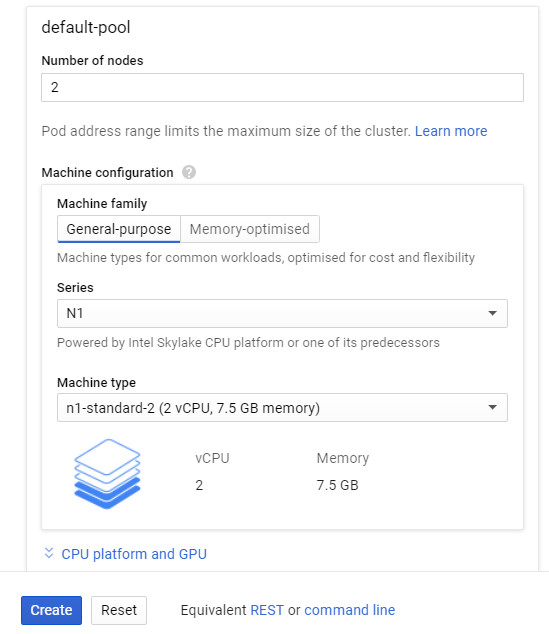
1. Tạo cluster
Trên gcp thì tạo cluster bằng console, mình đã chọn loại N1 standard 2 (2vCPU,7.5GB memory), tạo cluster chứa 2 node như vậy
2. Tạo namespace
kubectl create -f kube-logging.yaml
3. Tạo ElasticSearch master
The first node of the cluster we’re going to setup is the master which is responsible of controlling the cluster.
kubectl create -f elasticsearch-master.yaml
4. Tạo ElasticSearch data
The second node of the cluster we’re going to setup is the data which is responsible of hosting the data and executing the queries (CRUD, search, aggregation).
kubectl create -f elasticsearch-data.yaml
5. Tạo ElasticSearch client
The last but not least node of the cluster is the client which is responsible of exposing an HTTP interface and pass queries to the data node.
kubectl create -f elasticsearch-client.yaml
Wait for all pods in state READY 1/1
$ kubectl get pods -A
NAMESPACE      NAME                                                      READY   STATUS    RESTARTS   AGE
default        docker-postgres-cf447b874-p8gbq                           1/1     Running   0          25m
default        docker-spring-boot-containers-7c694df96b-qznth            1/1     Running   0          25m
kube-logging   elasticsearch-client-784cbb477-s7mkq                      1/1     Running   0          2m8s
kube-logging   elasticsearch-data-0                                      1/1     Running   0          2m18s
kube-logging   elasticsearch-master-56fd947c4c-8brls                     1/1     Running   0          2m25s
kube-system    kube-dns-5f886bf8d8-5km8c                                 4/4     Running   0          28m
kube-system    kube-dns-5f886bf8d8-vknfr                                 4/4     Running   0          28m
kube-system    kube-dns-autoscaler-85f8bdb54-d946p                       1/1     Running   0          28m
kube-system    kube-proxy-gke-efk-stack-tf7-default-pool-3b51bccc-lzpf   1/1     Running   0          28m
kube-system    kube-proxy-gke-efk-stack-tf7-default-pool-d645c580-blss   1/1     Running   0          28m
kube-system    kube-proxy-gke-efk-stack-tf7-default-pool-e1ba0508-lk35   1/1     Running   0          28m
kube-system    l7-default-backend-8f479dd9-fx4wg                         1/1     Running   0          28m
kube-system    metrics-server-v0.3.1-8d4c5db46-lqrmp                     2/2     Running   0          28m
kube-system    tiller-deploy-9bf6fb76d-wj229                             1/1     Running   0          26m
Chờ 1 vài phút để các pods của elastic READY:
kubectl logs -f -n kube-logging \
  $(kubectl get pods -n kube-logging | grep elasticsearch-master | sed -n 1p | awk '{print $1}') \
  | grep "Cluster health status changed from \[YELLOW\] to \[GREEN\]"
6. Generate a password and store in a k8s secret
We enabled the xpack security module to secure our cluster, so we need to initialise the passwords. Execute the following command which runs the program bin/elasticsearch-setup-passwords within the client node container (any node would work) to generate default users and passwords.
kubectl exec $(kubectl get pods -n kube-logging | grep elasticsearch-client | sed -n 1p | awk '{print $1}') \
    -n kube-logging \
    -- bin/elasticsearch-setup-passwords auto -b
Output
$ kubectl exec $(kubectl get pods -n kube-logging | grep elasticsearch-client | sed -n 1p | awk '{print $1}') \
    -n kube-logging \
    -- bin/elasticsearch-setup-passwords auto -b
Changed password for user apm_system
PASSWORD apm_system = eo83yYSKxR49QTx5eNx3

Changed password for user kibana
PASSWORD kibana = tdrr6dMWenSJiOX2eGDN

Changed password for user logstash_system
PASSWORD logstash_system = qf5dXCaYfLJflugUpGtB

Changed password for user beats_system
PASSWORD beats_system = PF75DeqUbWU5TusncL1l

Changed password for user remote_monitoring_user
PASSWORD remote_monitoring_user = 54Nmz6CSaejkcJwgijtP

Changed password for user elastic
PASSWORD elastic = S7kuf4HCinVdMp3Vtrkx
Note the elastic user password and add it into a k8s secret like this:
kubectl create secret generic elasticsearch-pw-elastic \
    -n kube-logging \
    --from-literal password=S7kuf4HCinVdMp3Vtrkx
7. Tạo Kibana
kubectl create -f kibana.yaml
8. Tạo Fluentd
kubectl create -f fluentd.yaml
Wait for all pods in state READY 1/1
$ kubectl get pods -A
NAMESPACE      NAME                                                      READY   STATUS    RESTARTS   AGE
default        docker-postgres-cf447b874-p8gbq                           1/1     Running   0          29m
default        docker-spring-boot-containers-7c694df96b-qznth            1/1     Running   0          29m
kube-logging   elasticsearch-client-784cbb477-s7mkq                      1/1     Running   0          5m31s
kube-logging   elasticsearch-data-0                                      1/1     Running   0          5m41s
kube-logging   elasticsearch-master-56fd947c4c-8brls                     1/1     Running   0          5m48s
kube-logging   fluentd-c48hz                                             1/1     Running   0          78s
kube-logging   fluentd-j9g7m                                             1/1     Running   0          78s
kube-logging   fluentd-xtk8k                                             1/1     Running   0          78s
kube-logging   kibana-5f8cb9b596-jvllj                                   1/1     Running   0          85s
kube-system    kube-dns-5f886bf8d8-5km8c                                 4/4     Running   0          32m
kube-system    kube-dns-5f886bf8d8-vknfr                                 4/4     Running   0          31m
kube-system    kube-dns-autoscaler-85f8bdb54-d946p                       1/1     Running   0          31m
kube-system    kube-proxy-gke-efk-stack-tf7-default-pool-3b51bccc-lzpf   1/1     Running   0          31m
kube-system    kube-proxy-gke-efk-stack-tf7-default-pool-d645c580-blss   1/1     Running   0          31m
kube-system    kube-proxy-gke-efk-stack-tf7-default-pool-e1ba0508-lk35   1/1     Running   0          31m
kube-system    l7-default-backend-8f479dd9-fx4wg                         1/1     Running   0          32m
kube-system    metrics-server-v0.3.1-8d4c5db46-lqrmp                     2/2     Running   0          31m
kube-system    tiller-deploy-9bf6fb76d-wj229                             1/1     Running   0          29m
Check logs của Fluentd Pod nếu show ra tương tự như sau, ko có error gì là ok
kubectl logs -n kube-logging <POD_NAME> -n kube-logging
# kubectl logs -n kube-logging fluentd-c48hz-n kube-logging
output:
2019-11-25 03:16:39 +0000 [info]: adding match pattern="fluent.**" type="null"
2019-11-25 03:16:39 +0000 [info]: adding filter pattern="kubernetes.**" type="kubernetes_metadata"
2019-11-25 03:16:39 +0000 [info]: adding match pattern="kubernetes.var.log.containers.**kube-logging**.log" type="null"
2019-11-25 03:16:39 +0000 [info]: adding match pattern="kubernetes.var.log.containers.**kube-system**.log" type="null"
2019-11-25 03:16:39 +0000 [info]: adding match pattern="kubernetes.**" type="elasticsearch"
2019-11-25 03:16:40 +0000 [warn]: #0 Detected ES 7.x or above: `_doc` will be used as the document `_type`.
2019-11-25 03:16:40 +0000 [info]: adding source type="tail"
2019-11-25 03:16:40 +0000 [info]: #0 starting fluentd worker pid=11 ppid=6 worker=0
9. Tạo 1 app liên tục out ra log để test
kubectl create -f counter.yaml
10. Test
Make sure all pods are in Running state and READY 1/1, 2/2, 3/3, 4/4 ….
kubectl get pods --all-namespaces
get NodePort of service Kibana
kubectl get svc --all-namespaces
output
NAMESPACE      NAME                           TYPE        CLUSTER-IP      EXTERNAL-IP   PORT(S)             AGE
default        service/kubernetes             ClusterIP   10.116.0.1      <none>        443/TCP             10m
kube-logging   service/elasticsearch-client   ClusterIP   10.116.9.216    <none>        9200/TCP,9300/TCP   6m34s
kube-logging   service/elasticsearch-data     ClusterIP   10.116.14.205   <none>        9300/TCP            6m46s
kube-logging   service/elasticsearch-master   ClusterIP   10.116.10.136   <none>        9300/TCP            6m56s
kube-logging   service/kibana                 NodePort    10.116.1.237    <none>        5601:32141/TCP      2m15s
kube-system    service/default-http-backend   NodePort    10.116.3.142    <none>        80:32636/TCP        10m
kube-system    service/heapster               ClusterIP   10.116.10.12    <none>        80/TCP              10m
kube-system    service/kube-dns               ClusterIP   10.116.0.10     <none>        53/UDP,53/TCP       10m
kube-system    service/metrics-server         ClusterIP   10.116.12.232   <none>        443/TCP             10m
Ta thấy NodePort của Kibana là 32141
get external ip of nodes
kubectl get nodes --output wide
output
NAME                                                STATUS   ROLES    AGE     VERSION           INTERNAL-IP   EXTERNAL-IP     OS-IMAGE                             KERNEL-VERSION   CONTAINER-RUNTIME
gke-efk-stack-advanced-default-pool-eeaed3c6-kx6f   Ready    <none>   9m44s   v1.13.11-gke.14   10.128.0.11   34.67.152.105   Container-Optimized OS from Google   4.14.138+        docker://18.9.7
gke-efk-stack-advanced-default-pool-eeaed3c6-rj79   Ready    <none>   9m44s   v1.13.11-gke.14   10.128.0.12   34.66.70.31     Container-Optimized OS from Google   4.14.138+        docker://18.9.7
Ta có thể chọn 1 Node IP để truy cập, ví dụ trên thì
<EXTERNAL-IP> = 34.67.152.105
<NODOE_PORT> = 32141
Create a firewall rule to allow TCP traffic on your node port:
gcloud compute firewall-rules create kibana-node-port --allow tcp:<NODOE_PORT>
Nếu đã có sẵn thì cần update chứ ko thể tạo mới
gcloud compute firewall-rules update kibana-node-port --allow tcp:<NODOE_PORT>
Hoặc các bạn nên mở all NodePort từ 30000-32767 bằng command sau:
gcloud compute firewall-rules update kibana-node-port --allow tcp:30000-32767
rồi trên trình duyệt vào http://<EXTERNAL-IP>:<NODOE_PORT> để check
Login bằng user elastic và passw đã generate ở step trên
Tạo index-pattern : logstash-*
Vào Discover, check logs Nếu chỉ show log của namespace default là Done!
Nếu muốn sửa ConfigMap của Fluentd thì cần chú ý là sau khi sửa xong thì sau khi apply template mới,
bạn phải delete các pods fluentd cũ để nó apply các config vừa thay đổi
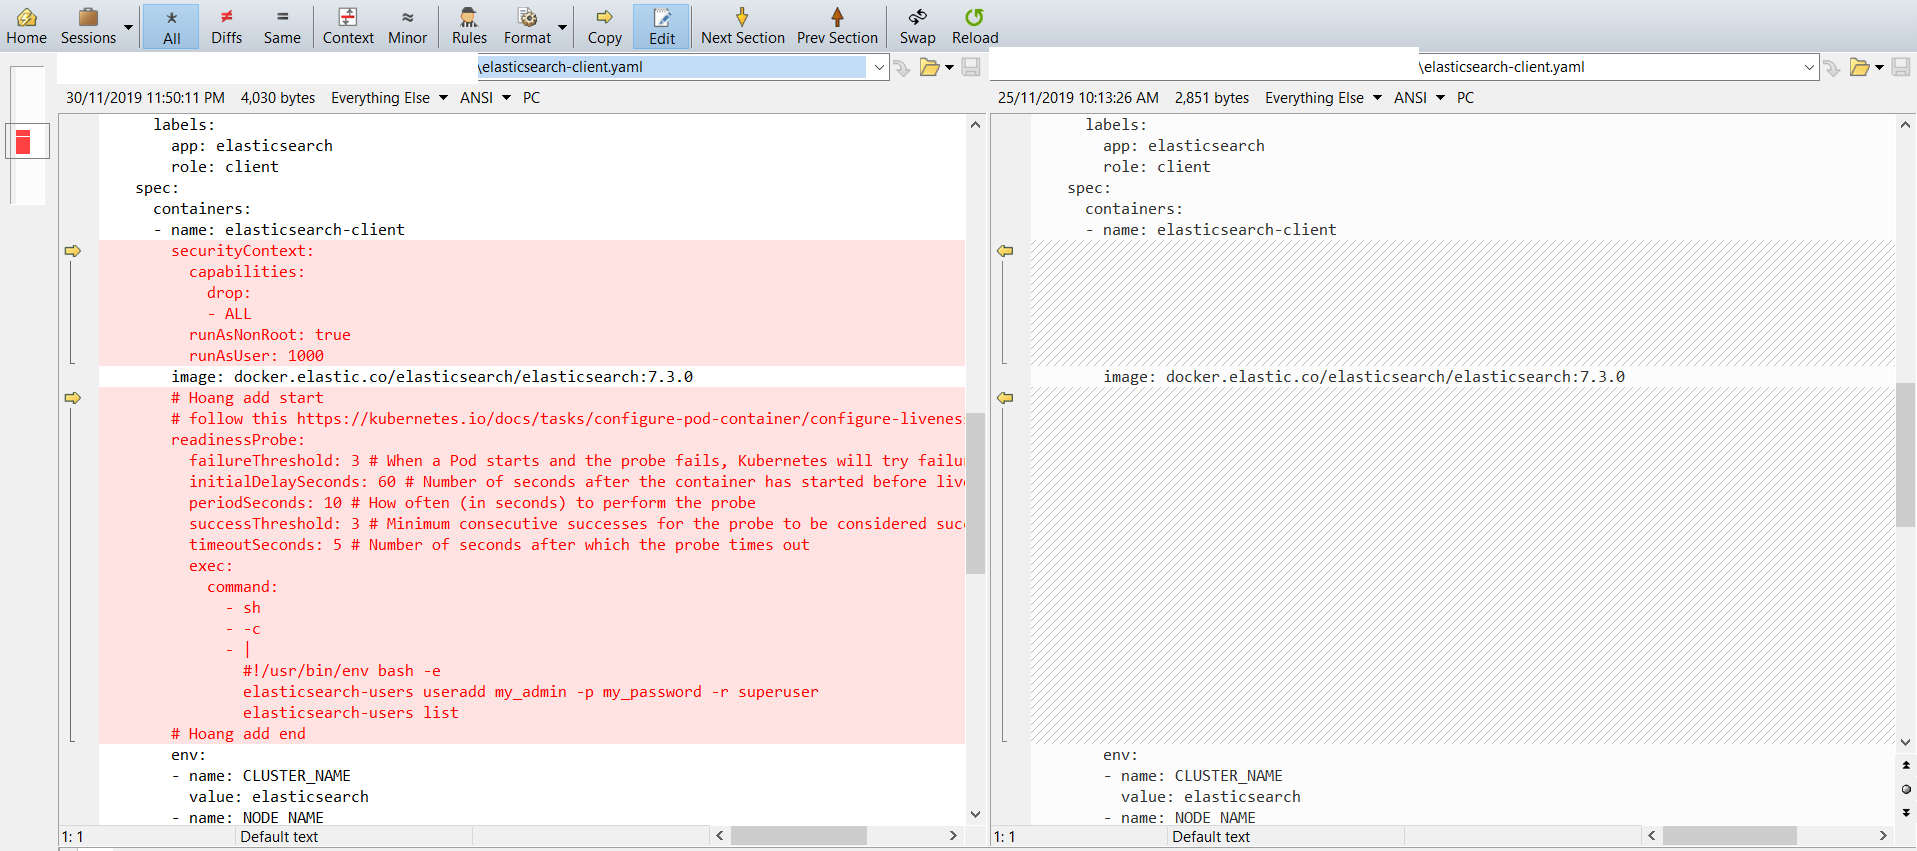
11. Dùng Helm để deploy
Ở các bước từ 1-10 trên đã hướng dẫn setup EFK bằng tay rồi.
Giờ nếu muốn dùng Helm thì cần thay đổi 1 số chỗ. Cụ thể các bước trên thì có bước 6: Generate ra password là loẳng ngoằng nhất,
muốn chuyển sang tự động bằng Helm thì cần sửa các file:
elasticsearch-client.yaml (chủ yếu file này),
fluentd.yaml,
kibana.yaml
Sau khi sửa xong thì chỉ cần làm như sau là deploy cả hệ thống EFK advanced lên trong 1 nốt nhạc 😆
# Chú ý là cần cài đặt helm và tiller đã (có thể tham khảo bài trước K8S 5: Using Helm ...)
cd kubernetes-series/efk-stack-advanced-helm
helm install -n efk-stack .
Chờ khoảng 5phút, rồi quay lại step 10 để Test hệ thống, chú ý là đăng nhập kibana bằng user my_admin
DONE! 🎉🎉🎉
CREDIT
https://kauri.io/article/e5b86351f38940b8a071267062f052cb/v2/monitoring-kubernetes-with-elastic-stack-2.-elasticsearch-and-kibana
https://github.com/gjeanmart/kauri-content/blob/master/spring-boot-simple/k8s
https://blog.ptrk.io/tweaking-an-efk-stack-on-kubernetes/
https://github.com/GoogleCloudPlatform/click-to-deploy/tree/master/k8s/elastic-gke-logging